×

Begin typing your search above and press enter

Method of Forecasting

What is Forecasting?

Forecasting is the process of making predictions considering the data in the past, present, and events occurring in the future to predict the future sales, revenue, and profits of the company.

Focus on demand forecasting, after the COVID-19 pandemic, has comparatively increased. Supply chains around the world are facing major disruptions and difficulties adjusting to new demands and changing customer behavior due to lockdowns

Forecasting helps businesses improve their decision-making processes regarding risk management, cash flow, capacity planning and workforce planning as well. Better forecasting accuracy enables lower inventory levels and eventual reduction in finance and warehousing costs.

Understanding how to forecast your supply chain requirements is crucial to the success of your e-commerce store. Getting it correctly can lead to stronger supplier relationships, higher customer happiness, and more capital to help your company expand and scale.

Methods of forecasting:

In order to handle the complexities involved in developing any forecasts, many forecasting techniques have been used by businesses which suit their needs.  

Selection of the right method depends on various factors like availability of past data, market demand understanding, desired accuracy in forecasting, time required in preparing the forecasts, etc. 

The widely used forecasting methods can be broadly be categorized in to following two methods:

  1. Qualitative Methods
  2. Quantitative Methods

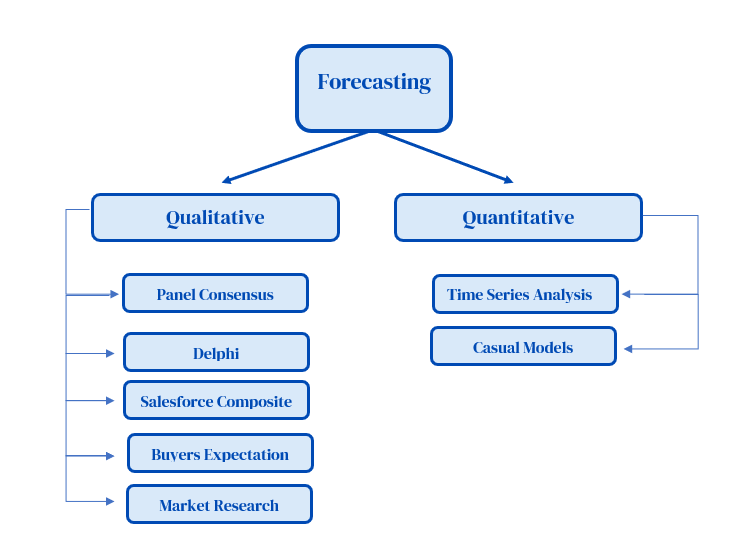
   1. Qualitative Methods:

When there is a scarcity of data, qualitative sales forecasting approaches are applied. When introducing a new product to the market, for example, qualitative procedures can be used. There is insufficient information on the product to make future predictions. The techniques rely on human judgment and rating schemes to convert qualitative data into quantitative estimates. The method’s goal is to bring all of the judgments and information about the elements being estimated together logically and methodically. The following are five qualitative techniques:

  1. Panel Consensus: The simplest technique is panel consensus, it is based on the idea that a group of specialists in several domains may provide a better forecast than a single person. The technique is no secret, and discussion between professionals is permitted.
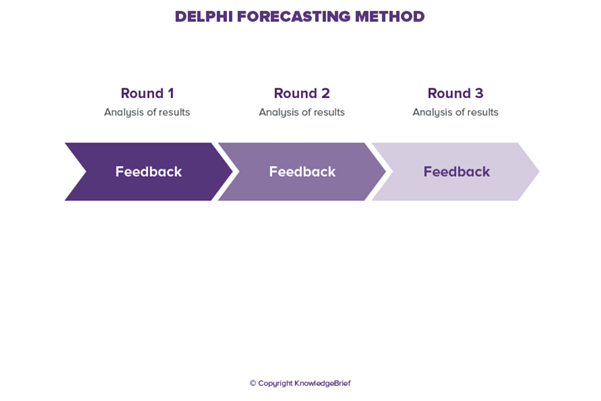
  2. Delphi Method: The Delphi method is a revenue forecasting strategy that employs surveys and questionnaires to estimate future sales. The Delphi approach aims to predict the likelihood of events occurring and the time-frame in which they will occur. The Delphi approach, like panel consensus, involves experts and a Delphi coordinator.
  1. Salesforce Composite:

The corporation asks its salespeople to create forecasts using the sales force composite technique. The sales reps are assumed to have direct interaction with clients and other parties in the distribution chain. As a result, they will be more educated about a product’s demand.

  • Buyer’s Expectations:

You survey purchase intentions and market intents in this sales forecasting technique. If you wish to conduct a survey of buying intentions, you pick a sample of potential consumers and ask them about their future plans to acquire the goods. The entire demand projection is then calculated by extrapolating the data.

  •  Market Research:

Market research is a method of forecasting demand that combines both systematic and formal approaches. It entails putting real-world market theories to the test.

Advantages of Qualitative Techniques:

  1. Better Sales Projections
  2. More Flexibility in Forecasting
  3. Reducing Ambiguous Data

Drawbacks of Qualitative Techniques:

  1. Anchoring events and selective perception.

Forecasters that use anchoring events allow recent occurrences to impact their perceptions of future events.

  • Selective perception:

Forecasters who use selective perception dismiss significant evidence that contradicts their idea of how the future will develop.

  1. Quantitative Methods:

The quantitative forecast approach employs historical data to forecast future data, particularly numerical data with a continuous pattern. This strategy is commonly used to make short-term forecasts. It is objective in character and based on mathematical models.

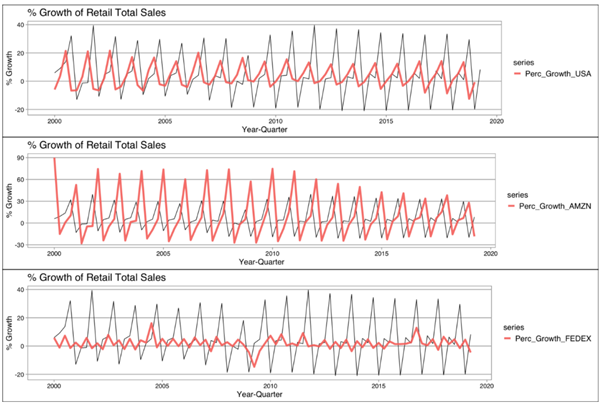
  1. Time Series Analysis

When you have years of data about a product or product line, you can utilize the Time Series analysis sales forecast technique. It can also be used when there are evident trends and relationships regarding a product that is stable. The forecaster calculates the current performance rate and rate change using historical data on the product’s performance. The basis of forecasting is the acceleration or slowing of present rates. A time-series approach is a collection of chronologically arranged raw data points. A time-series analysis can help you understand:

  1. Trends in the data
  2. Cyclical performance patterns that repeat any two or three years
  3.  Any systematic variation or regularity of data in different seasons
  4.  Growth rates of various trends in data.
  1. Causal Models

When you have adequate historical data and analysis on a product, you can create causal sales and forecasting models. The investigation should include the factors you want to forecast as well as other economic and socioeconomic aspects. The causal model should be used if you require complex sales and forecasting models. It expresses the important causal relationship and can contain information from market surveys and other factors. A time-series analysis can also be incorporated into the technique. It takes into account the flow system’s characteristics and makes predictions about connected events like promotions and strikes.

Advantages of Quantitative Methods:

  1. Addresses Historic Data Exposes Patterns
  2. Attracts Stakeholders
  3. Offers comprehensive projections

Disadvantages of Quantitative Methods:

  1. Lacks Detail
  2. May be difficult to interpret
  3. Can be Costly

What’s new?

Traditional forecasting models such where only historical data is considered are getting obsolete as a result of the increased amount of data generated from businesses and external sources. Implementation of machine learning algorithms into businesses in supply chain management companies can improve the accuracy of the forecasting results and optimize their restock cycles.

Machine learning takes demand forecasting to the next stage. It facilitates enhanced forecasts based on real time data using internal and external data sources such as weather, demographics, online reviews and social media, etc. Machine learning algorithms can easily adapt to external changes. With the help of this external data and machine learning algorithms it becomes easy to manage supply chain networks rather than managing it manually.

How we can help?

At Accurest, we believe that businessman has the most appropriate idea for the expected demands of any product either new or one which has a historical data.  

For products have historical sales data, we prepare the forecasts using the available past sales data and an expected growth %.  These are then revisited on frequent intervals in order to analyze the deviations from the actuals and the forecasts are then updated.

For new products, the forecasts are initially based on individual judgement of the businessman. Close monitoring is done for any newly launched products to update the forecasts at much lesser intervals. This helps in getting more accurate forecasts for such new products.

Types of Seasonality in Forecasting

What is Seasonality?

Not every product which is stocked in the warehouse sells at the same rate throughout the year. Sales for certain products increase or fall due to various factors. Some of these factors are constant throughout the life cycle of the product. This, in simple terms can be called as seasonality of the product.

Seasonality is defined as changes in sales based on a particular season. It is a market characteristic in which a product’s sales grow much more for a period of a few days, weeks or months each year and then drop off considerably in the other period. They comprise periodic, repetitive, and regular patterns that the seller is aware off.

Understanding the seasonality of any product is most important aspect in developing the procurement plans in a better manner.

When the product sales are going to increase, considering the seasonality, it is important for the seller to have enough stock of the product to ensure that there is no potential revenue loss due to out-of-stock situations.

On the other hand, towards the end of seasonality, it is important that the procurement is planned such that there is no overstock situation and any new orders are then placed considering the same. 

Broad Categorization of Product Seasonality:

Any product’s seasonality can broadly be classified into below 2 categories –

  • Natural Seasonality:  Natural Seasonality is caused by natural factors such as changing weather and climate across different regions (Spring, Summer, Winter, Autumn, Rainy, etc.).

These are macro factors that affect all the products at large. A product may be a seasonal product that is useful in specific weather but not in another like the demand for umbrellas will be higher in a rainy season. To learn more about how to forecast the demand and plan procurement for products affected by Natural Seasonality, you can read our blog on Effects of Natural Seasonality on a Product.

  • Event-based Seasonality: Event-based seasonality, as it says, occurs due to special events (like Prime Day, Black Friday), festivals (like Christmas, Diwali), holidays (like New Year, Chinese Ney Year). People tend to celebrate the New Year or different festivals by spending and generally there are discounts during special events hence companies experience a higher number of sales during these periods compared to other periods during the year.

Let’s take the example of sale of cars in 4 different countries namely India, the USA, Japan, and China

The predicted pattern or Season in the sales of vehicles is that during the festival and discount season the sales are the highest in almost all of these countries.

The discount season shows the most sales in all the countries, as people tend to buy cars during either financial year-end or during the discount seasons.

India, USA, and Japan generally observe an increase in the sales in their respective festival /discount seasons. While, China has its festival in February, the sales of vehicles are lower during this month which comes just after its discount season hence generally, there is a decline in the sales during February in China.

  • Event-based Seasonality:

Events are generally planned considering the consumed purchase pattern. These patterns can further be classified as under –

  1. Daily Seasonality:

Daily seasonality refers to the days in a week when demand for certain products/services is high. Daily seasonality helps in short-term planning and forecasting for a business.

For example, research from gallup.com found that people tend to spend more on weekends. This spending usually includes food items, clothes, and other daily needs.

Another example of daily seasonality is the operations of fast-food chains like dominos pizza. The sale of pizza increases on weekends hence, it becomes important that the forecasts for the weekends are accordingly increased and the raw materials procurement is then increased for the weekends. It needs to be ensured that required raw material reaches the store before the weekend begins so as to avoid any shortage of materials during rush hours.

  • Weekly Seasonality:

Weekly seasonality is similar to that of daily seasonality but the forecasts are adjusted according to the trends for every week instead of day. Generally, people tend to spend more during the first week of the months as compared to the rest of the weeks since the pay checks are received during the first week of a month. Accordingly, forecast for 1st week should be higher for such products which are to be affected.

Seller run different deals, promotions, etc. during certain week of a different months in order to attract more customers.  Some common examples of weekly seasonality are the special discount periods like Black Friday, Amazon Prime Day, Cyber Monday, etc. Product salesgenerally tend to increase during these periods since seller offer high discounts on most of their products.

Thus, it becomes very important to adjust the forecasts considering these fluctuations that happen due to these special events.  Procurement planning needs to be done such that that there is enough stock before these events/weeks begin.

All strategical decisions should be taken like whether to do air-shipment, sending stock to Amazon, etc. considering the relevant lead time. For instance, we should send stock to Amazon for Black Friday considering taken to send the goods to Amazon and receiving time, some natural delay and some buffer. Since you cannot afford to have stock outs due to non-replenishment, this is a very important decision.

  • Monthly Seasonality:

Monthly seasonality is referred to the events or seasons that are predictable and follows a recurring pattern that affects the demand and sales of a product/service same month/s every year. Monthly seasonality is considered while forecasting for the long term.

The monthly seasonality is mostly holiday seasons when the sale of commodities is the highest and customers tend to spend more. The holiday months vary as per the geographic location.

To understand this further, let’s consider a scenario in which a new airline company plans to forecast the frequency of the flights and the pricing for flights that will be flying to the 4 different countries India, the USA, Saudi Arabia, and China. To forecast this, the company will need previous data on the number of tourists that have arrived in these countries and analyze the same for each month.

It can be observed from the data that, India experiences high international arrivals in August and December while Saudi Arabia has the highest number of tourist arrivals in January and September. USA sees the maximum international tourist arrival in August and December while China has the highest number of foreign tourist arrivals in April and October.

This can now be considered as monthly seasonality for these countries the airline can accordingly plan the flights and prices during these months across the different countries.

  • Yearly Seasonality:

Yearly seasonality is referred to as the changes in sales of a particular product year-on-year. These changes may be due to different circumstances, natural phenomena, or the introduction of similar products in the market during the year.

For instance, during the outbreak of Covid 19, the sales of some products increased while there was a sharp decline in the sales of many commodities.  Another example of yearly seasonality is the decreasing sales of combustion engine vehicles year over year due to the introduction of Electric Vehicles.

Given below is the representation of the yearly seasonality, the graph shows the revenue generated (in billions) by Fast Moving Consumer Goods over the years. This accounts for the year-on-year increase in spending on FMCG goods.

It becomes important to consider these circumstances while forecasting since the forecasts will have to accordingly adjusted in order to reflect the probable effect on sales. For e.g. post Covid forecasts for product sales affected by Covid outbreak will have to be adjusted such that the effect of decrease in sales in the covid years are neglected. 

The procurement for material would also be required to be adjusted considering the same and it would be important that planning is done with more accuracy and considering the further possible scenarios as well.

What we do?

Most of the times the past sales data are clearly evident of the seasonality for any products. Based on the deviation from the average sales for the period one can easily identify the top selling as well low selling periods. Once this is identified, we then adjust the forecasts for the similar period to reflect the increase or decrease in sales. Further procurement planning is then revised in order to reflect the most recent updated forecasts.

Identifying seasonality for new products is comparatively harder since there is no clearly available sales trend. For such products, we refer to seasonality of the similar products which the seller sells or of the category the product belongs to. However, the seller has the best idea when the product would sell in its peak and when there would be a dip in sales. Forecasts are then adjusted accordingly. 

Effect of Natural Seasonality on a Product

What is Seasonality?

Seasonality is defined as changes in sales based on a particular season. It is a market characteristic in which a product’s sales grow much more for a period of a few days, weeks or months each year and then drop off considerably in the other period.

Any product’s seasonality can broadly be classified into below 2 categories –

  1. Natural Seasonality
  2. Event-based Seasonality

Read more about What is Seasonality and Event based Seasonality in our blog “Event-based Seasonality”.

Forecasting the sales of seasonal products involves the study of geographical science. If a product is to be sold worldwide, the forecasters need to understand the weather of the area in which the products are to be sold.

Natural Seasonality?

The fluctuations in the sales of a product that occur due to the changing natural seasons irrespective of any promotion or discount on that particular product is what can be termed as Natural seasonality of the product.

For instance, we generally assume that the weather differs from country to country. It does but not on the basis of the longitudinal location (East to West). It is based on hemispheres that determine the weather changes.

This could be understood better by considering the example of the countries like USA, UK, and Australia.

The weather conditions in the US and the UK are similar as they lie in the same hemisphere whereas it will be different for USA and Australia which is depicted below –

Seasonality of Sweaters: 

Let us consider a sweater manufacturing company that has to forecast the export of sweaters to two countries USA and Australia.

As seen in the table above, USA experiences winters between December and February while Australia experiences the same between June and August. This means that the peak in the sales of sweaters should be in these months respectively in USA & Australia.

Thus, keeping the production capacity same throughout the year can prioritize the export quantities as per the seasonality of the two countries. The monthly forecasts for each country can accordingly be planned and the related procurement planning can be smoothened considering the overall forecasts.

Seasonality of umbrellas:

Now let’s see the classic example of Umbrella!! 

The sale of umbrellas in any region generally depends on the rainy season of that area. 

Sales of umbrellas Rainy season

Chart of Umbrella sales with millimeters of rain in the region

The chart clearly shows the correlation between the rainy season is directly proportional to the sales of umbrellas. Even if we look at the trendline of the factors, they seem parallel to each other. 

While forecasting one needs to keep in the mind the region where the product will be sold as well as what would be the rainy season period in that region. This will further drive the procurement planning and accordingly the raw material required needs to be restocked so that timely supply can be made in each of the regions before the start of the season in the respective regions.

  • Important Aspects
  • For sale of products mainly driven by natural seasonality, it is important to forecast the sales more minutely considering the seasons.  If not done correctly, there can be understock situation which will result in loss of revenue or overstock situation which will have a high impact on finance and storage costs.
  • Procurement of the material required for such products (for either manufacture or retail store seller) needs to be done much before the seasons start (considering the overall lead times) so that the products can be delivered to the warehouses before the season beings.

References:  

For the charts data – https://weather-and-climate.com